SMC Scanner for TradingView: How to Use an Order Block Indicator Faster
Traders search “SMC scanner” because opening 50 charts by hand is slow. A scanner shortlists names near order block zones. An order block indicator then helps you study the reaction — not the other way around.
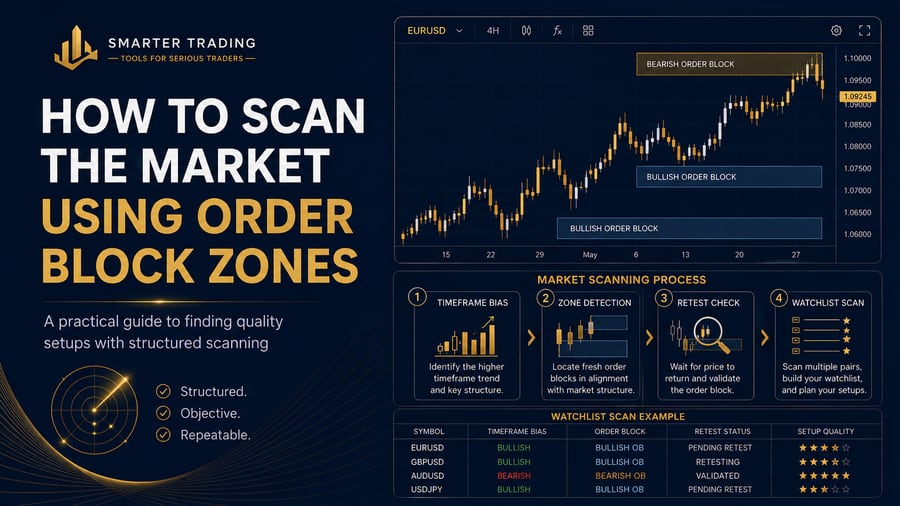
Scan first, then open a small shortlist. Educational workflow only — not trade signals.
What is an SMC scanner?
An SMC scanner (also called an SMC screener) is a TradingView workflow that checks a watchlist for symbols near Smart Money Concept areas — typically fresh or retested order block zones.
It does not tell you to buy or sell. It answers a simpler question: which charts are worth opening today?
If you trade NSE indices and stocks, the practical version is a Nifty Order Block Screener on a Nifty / Bank Nifty basket.
SMC scanner vs order block indicator
Google also ranks order block indicator TradingView next to scanner searches. They are different tools:
- SMC scanner / screener — watchlist pass. Finds symbols near zones.
- Order block indicator — chart overlay. Marks zones, structure and alerts on the symbol you already opened.
- Demand & Supply MTF — multi-timeframe zones plus educational Entry + SL + 1:1 / 1:2 / 1:3 target projections.
Use the scanner to cut noise. Use the SMC Order Block Indicator or SMC + Demand & Supply MTF 3.5 to study the shortlisted chart.
A 4-step scanner routine
1. Bias on the index
Before scanning stocks, check Nifty / Bank Nifty structure. If the index is messy, keep the shortlist tiny or skip. Scanner results without bias become random clicks.
2. Run the watchlist scan
Scan your Nifty list for names sitting at fresh or retest order block zones. Ignore distant zones price cannot reach in your session.
3. Confirm on the chart
Open 1–5 names only. Wait for a reaction at the zone (rejection, displacement, or your candle rules). No reaction = no trade.

After the scan: Demand & Supply / order block context on the selected chart.
4. Plan risk, then stop
Invalidation outside the zone, size from risk %, daily loss limit. Scanning more symbols never fixes a broken risk rule.
For the full scanning checklist, see How to scan the market using order block zones.
Add MTF 3.5 after the scan
Once a name is on the shortlist, multi-timeframe Demand & Supply helps you see whether the zone is just a lower-timeframe scalp or sits inside a higher-timeframe area.

Educational levels: Entry + SL + 1:1 / 1:2 / 1:3 Target Projections. Chart references only.
Read the step-by-step MTF guide: SMC + Demand & Supply MTF 3.5 practical guide. Trial users can also download the public Professional User Manual (PDF).
FAQ
Does an SMC scanner replace chart reading?
No. It only shortlists. Final decisions stay on the chart with your confirmation and risk rules.
Is this the same as a “block trade indicator”?
No. Block trades are large reported deals. SMC here means Smart Money Concepts — order blocks and related structure on the chart.
Educational content only. Not personalised financial advice. Equity and F&O trading involve substantial risk of loss.
Start Free Trial Nifty SMC Screener